Sunday, September 18, 2016

First Impressions of HarborPoint

The Dutch have to wrestle new land from the sea. Baltimoreans get it from old industrial sites. The latest example: Harbor Point which older residents may remember as the site of the Baltimore plant of Allied Signal, a big chromium plant that was shuttered in the late eighties and had no public site for at least a hundred years.

Without much fanfare Baltimore just added a few new streets to its map. It took 27 years of planning to figure out how life should unfold on the peninsula after the chromium plant came down. No less than three planned unit development (PUD) plans were conceived  and adopted, the first when even neighboring Harbor East was mostly still a plan on paper, the latest allowing 3 million square feet of development.

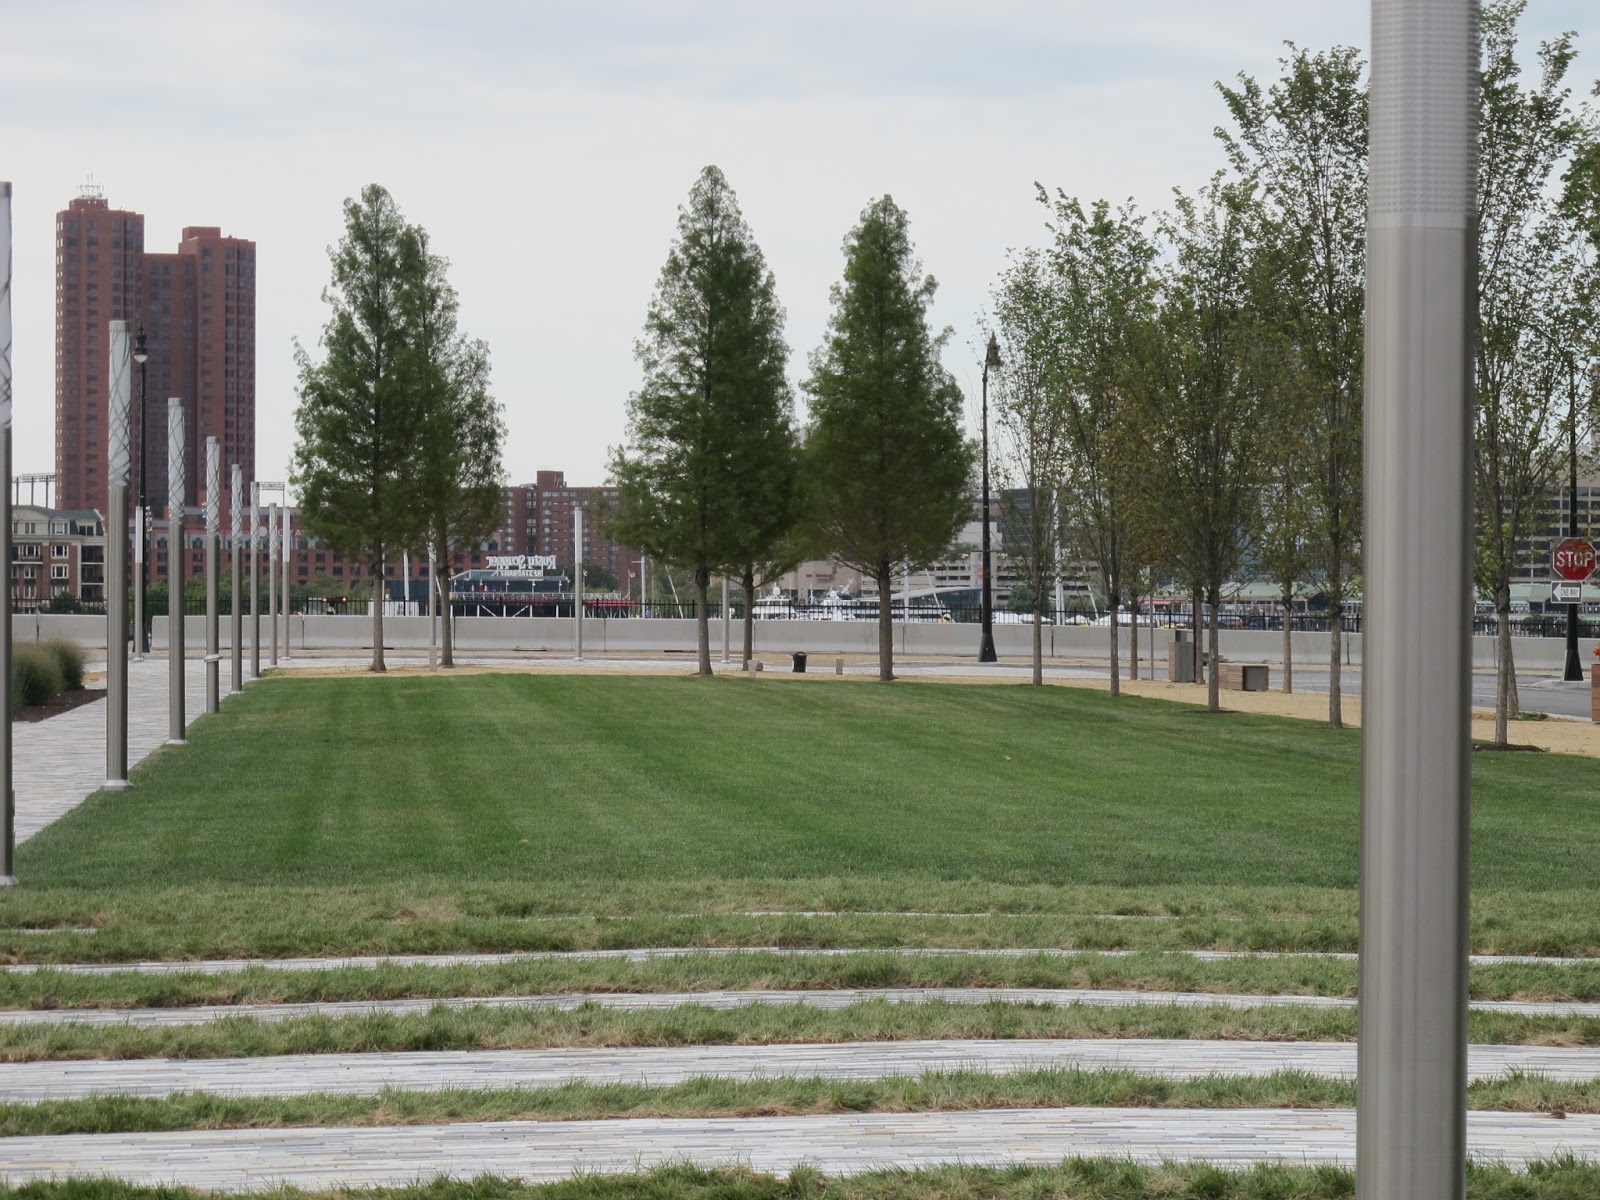
the new plaza in front of the Exelon building is now nearly complete
Now for the first time in a century, anybody who wants to can walk, bike, or even drive onto the peninsula. So far one can visit a restaurant, shop, park or simply take in an entirely new view of Baltimore's Inner Harbor and downtown. The first residents are already moving into the luxury apartments that were added to the Exelon Tower in a late revision of plans. The employees of the energy giant that bought Constellation which had bought BGE will relocate here during the next few weeks.

"You will see a real rapid increase in traffic', says Charlie Bind of Beatty Development, estimating that there would be about 1000 people on site by Christmas. Many of them, though are coming from the nearby Constellation building on Pratt Street and don't add new demand on area roadways. Bind also stated that the promenade around the perimeter of the site will open to the public at the end of October, the first benches and trees are already in place.
The Allied Signal Chrome works ca 1980 (photo: Mark Layton)
HarborPoint's buildings are erected on top of a clay and membrane cap that contains the hexavalent chromium contaminated soil beneath it. Only piles to support the buildings were allowed to penetrate the cap and were carefully sealed again. Everything else including utilities runs under a gigantic concrete podium that is currently only partly completed.  Streets, plazas and building entrances are all above that concrete podium which lifts the public spaces in the development area quite a bit above the level of the surrounding areas. The promenade will be directly on the cap and landscaped berms will mask the height difference between the waterfront walk and the podium. Eeventually there will be about 1000 parking spaces under the podium and an additional 2,000 parking spaces in garages that will be wrapped by development.
Aerial of Allied Signal with downtown in the background

Due to these grade differences Harborpoint will not  integrate into the city fabric as easily as Harbor East, even though Dock and Wills Streets are extensions of the Street grid and Central Avenue will be extended to the site with a bridge soon be constructed,

Access and circulation are difficult on a peninsula anyway, especially when the surrounding road network is already hopelessly overburdened. Much of the success of Harborpoint will depend on a robust menu of options that avoid car usage by employees, residents and shoppers on the site. The expanded water taxi is supposed to offer a stop at the south-shore on a reconstructed pier that is not yet in place. The Circulator offers pretty good access but its budget woes make cuts likely. Beatty Development has an agreement with Horseshoe Casino to offer their huge garage for daytime usage by commuters coming in from the B-W Parkway and plans to run a bus shuttle from there to Exelon.

During a recent presentation of the HarborPoint project to the transit advocacy group Transit Choices members of the group made several suggestions for reducing car traffic, including a transportation management plan, incentives for transit tickets and a robust live where you work program. It was also suggested that Beatty development could support the Circulator and fund a public route diversion to Horseshoe instead of installing yet another private shuttle.
Uphill on Dock Street  (photo: Philipsen)

The architects of Elkus Manfredi paid careful attention to the design of the public spaces. That became already apparent in the design review meetings with  UDARP and panel members made many additional good suggestions. From the  Initial impressions of the first phase it is hard to judge, whether reality will eventually match the nicely rendered plans.

Harbor East didn't have any of the current urbanity and bustling street life when only the Sylvan Learning Center had been completed or even when the Marriott had been added. It took many years before the backside of the hotel and its parking garage where hidden by the developments that followed and sufficient retail brought people in that walked the streets.

Currently Exelons structured garage is pretty dominant, even though cars are far better concealer than on any other garage in Baltimore. in 2013 UDARP had also engaged in lengthy discussions about how the three masses of the Exelon complex meet the ground, how the added apartments would be differentiated and how weel the cars would be screened behind the wire mesh. There were zinc clad frames that were to articulate structure and even mullion details were discussed. Now looking at the completed Exelon tower, its tinted glass is pretty menacing monolithic. The Legg Mason building and its Four Seasons twin across City Dock look by comparison more attractive and the overall mass more elegantly sculpted, provided that one can accept a full glass facade. For those who like brick, the perch from Harborpoint reveals that Harbor East is full of brick buildings and many of them are quite mediocre.
Shopping on HarborPoint (photo: Philipsen)

 Harborpoint won't have as much retail as Harbor East and an anchor like Whole Foods that was so instrumental on getting Harbor East going is not in sight for HarborPoint. The hope may be that these two areas will eventually work in tandem.

The HarborPoint peninsula will heavily depend on its 6 acre signature park for branding identity and as an attraction. The park is not yet in the works. The spectacular views from the promenade, however will soon be free for anybody walking along the water's edge. Thanks to its important position between downtown and popular Fells Point, HarbporPoint's  will close a strategic gap in the promenade which will ensure a steady stream of folks coming by and possibly also coming through this newest bit of Baltimore.

Klaus Philipsen, FAIA.
HarborPoint and Harbor East (both Beatty Development) have been used as an argument for and against tax increment financing (TIF) in the recent discussion about Port Covington.


below a photo gallery:

The Inner Harbor seen from Federal Hill in 1903

The Allied Site after it was cleared and capped with the Morgan Stanley
Building just off the cap (Photo: Honeywell)

Current condition as seen from Harbor East (Beatty Development)
Earlier rendering of build-out (Beatty Development)

The bridge abutment (the concrete wall) for the future Central Ave bridge show how high the streets
on the cap and podium are  (photo: Philipsen)

the future arrival point of Central Avenue on the peninsula  (photo: Philipsen)

Dock Street, a new address for luxury apartments  (photo: Philipsen)

The southwest corner of the site will be a 6 acre park but is still used as a surface parking lot
 (photo: Philipsen)

Mullions and zinc clad bands are very subtle modulations of a large bulk of dark materials  (photo: Philipsen)

The above ground parking garage for Exelon dominates Dock and Will Street to date  (photo: Philipsen)

Beginnings of the promenade: benches, planters and small trees

The Legg Mason and Four Seasons Towers, less dark, well sculpted  (photo: Philipsen)

Wills Street apartments on HarborPoint under construction

A view across the new plaza in front of the Exelon Building looking west with the Harbor Court tower to the west
 (photo: Philipsen)
Uneasy neighbor: The Living Classroom, different time, different scale, different grade
 (photo: Philipsen)

the view from HarborpPoints reveals a lot of rather predictable brick, sandstone architecture in Harbor East
 (photo: Philipsen) 

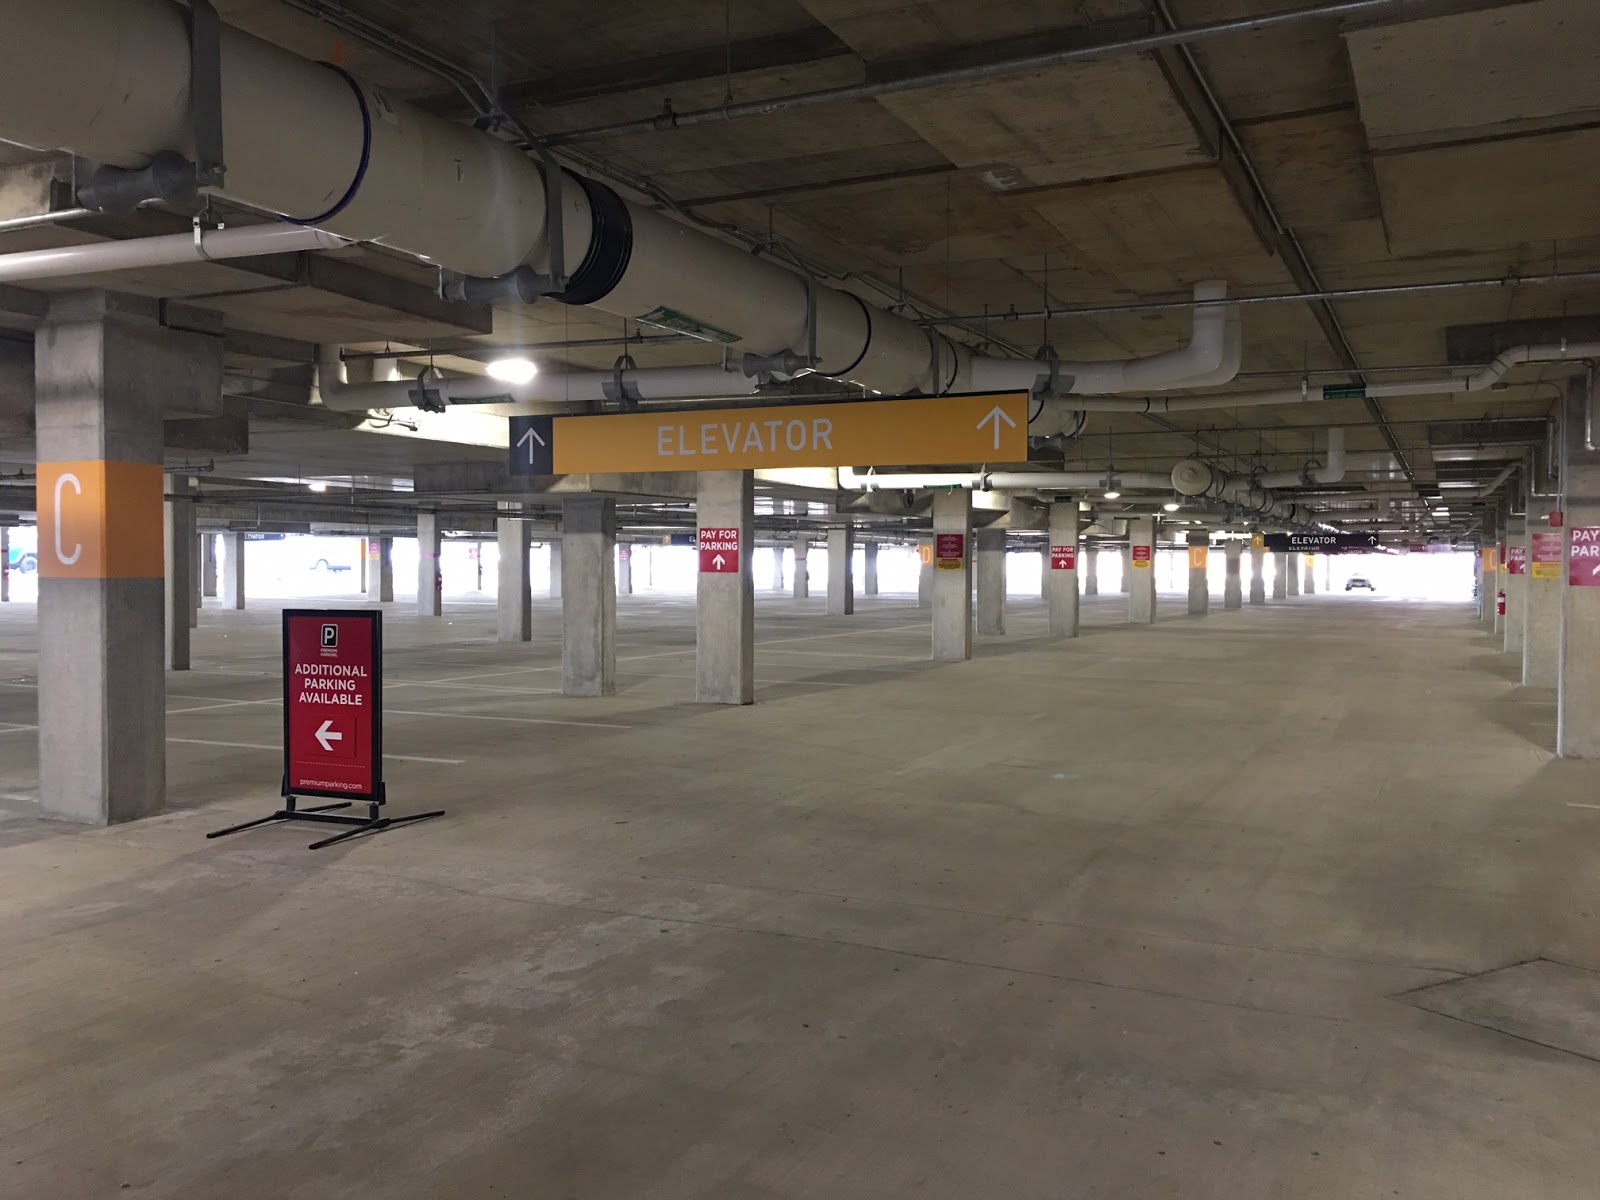
Under the plaza: The parking and infrastructure podium  (photo: Philipsen)

A promising sign: Bicycles outside the Morgan Stanley office building


Friday, September 16, 2016

Condemned to sprawl?

Usually the weekly blog articles do not show up on this daily blog site. However, I will make an exception today with a slightly modified up-front publication of  the weekly not Baltimore-centric topic. But with the Governor steering a more and more anti-smart growth agenda and Baltimore's prospective mayor frequently advocating for single family homes in Baltimore, this has also a lot of local meaning. 

When a Berkeley economist with a PhD from Berkeley and a Columbia PhD of urban planning duke it out about density and sprawl on national media, the sparring should be quite interesting, especially if one is Richard Florida, the same guy that in 2004 came up with the term creative class and the assertion that the creative class will need cities to thrive and revitalize them in the process, essentially a theory that predicted the current  migration of millennials to cities. Issi Romem, the economist, is the less well known, but he is no slouch either, having founded, just like Florida, his own research institute, BuildZoom.

Alas, in spite of Issi Romem's contention that sprawl is the best way of generating affordable housing and a litany of graphs showing that single family development is not only the domain of suburbia but also of all American cities. In short, that the choice is either expansive or expensive. Precisely the argument that David Rusk made in his book about Baltimore ("Baltimore unbound).

Florida has little to offer in the way of a rebuttal.

Sprawl on the Eastern Shore (Photo ArchPlan)
The background for the interesting debate is an article that Romem published Wednesday, the Wall Street Journal picked it up and Florida managed to comment on it the same day in CityLab. Since then the Washington Post and Bloomberg News have weighed in as well.

Here are Romems main take-aways (his own summary):
  • The link between housing production and outward expansion is unmistakable: cities that expand more produce proportionally more new housing.
  • Throughout the country, housing production is skewed towards low density areas.
  • Densification has slowed down across the board, and especially in expensive cities, undermining their ability to compensate for less outward expansion.
  • Unless they enact fundamental changes that allow for substantially more densification, cities confronting growth pressure face a tradeoff between accommodating growth through outward expansion, or accepting the social implications of failing to build enough new housing.
The matter isn't  about these two  guys, really, interesting as they may be, but whether sprawl or low density urban housing is really our fate forever. Florida just seems floored by the onslought of Romem's sprawl numbers. They seem overwhelmingly clear and hard to repudiate.
Urbanists like to think that the back-to-the-city movement has increased density and mitigated sprawl, but Romem shows that America has seen a long-run decline in density. (Florida in CityLab)
Developed land areas and low density uses (BuildZoom)
With a statement like this Florida folds his tent and seems to abandon in one sentence all he has propagated in the last 10 years or so. His objections are meek at best:
This long era of cheap, suburban growth has its limits. Many of our most expensive metros have reached the limits of outward expansion, and many others are headed toward it. Not to mention, reurbanization and densification are required both for future innovation and growth, and to address the mounting inequality and spatial segregation of America’s expensive cities. Our cities and the nation as a whole face some very tough choices ahead. (Florida in CityLab)
On second thought the discussion about the dominance of single family homes in the US is surprisingly shallow, given the academic credentials of these two folks:


  • Romem looks at periods from either 1940 to 2000 or from 1980 to now, which means that his numbers include times that are well known to have been the height of sprawl and urban flight. This isn't really anything new.
  • Romem gets his results not by comparing incorporated core cities but entire metro areas, an often shaky definition which clearly skews the data towards large lot sprawl development. 
  • Cost of housing is seen in simplistic terms ("building on green fields is cheaper") without distinguishing between land-cost and cost of structures and without mentioning "external costs" such as the environment and infrastructure usually not carried by the developers or home-buyers
  • Affordability is simply seen as housing cost without factoring in the transportation cost that cheap but far away housing necessarily produces
  • Especially Romem makes no mention of the social cost of sprawl and the systemic discrimination and racism policies that has driven and produced much of the outward development patterns of postwar America which arev largely segregation patterns  systematically sorting out the poor (left behind in cities and excluded from suburbs through large lot zoning etc.) and minorities (restrictive covenants, redlining, specific real estate practices etc.)
  • There is no mention of the lopsided way how housing is delivered in the US with a template in which speculative production of single family homes catering to the same price point any given suburban development as the dominant model adopted by practically all home-builders.
  • The study isn't fine-grained enough to detect recent demographic shifts that have brought about the first change to the prevailing housing production model in 60 years. More and more home-builders are now experimenting with urban infill mixed use models, usually of the "one plus five" variety of 3-5 wood framed stick-built apartment levels stacked on top of a concrete podium. That building type can now be found in cities all across the United States delivering tens of thousands of density dwelling units  and even some suburban centers like Columbia, MD or Stapleton, CO. 

Balto Wash area as a dynamic illustration from 1940-2010
Those omissions are especially confounding as both scholars are confessed friends of cities.
Of course cities should favor densification over the ills of sprawl. But if the past is any guide to the future, failing to expand cities will come at a cost. Cities that have curbed their expansion have -- with limited exception -- failed to compensate with densification. (Romem)

The Washington Post also finds little to critic and supports the argument with localized graphics showing dual metro area sprawl. WP summarizes the findings this way:
Romem’s data show that cities produce new housing in proportion to their rate of outward expansion. Metros that spread out the most add the most housing, and have kept their housing costs in check as a result. Metros that have resisted sprawl (like Portland, which has an urban growth boundary, or San Francisco, which is hemmed in by mountains and water) haven’t built much.
Cost is so much more complicated than that! The WP maps show how, both, DC and Baltimore sprawled, yet housing cost is still high not only in DC but even in Baltimore if one considers incomes as well.

Additional comments  that Romem sent to Bloomberg's Justin Fox via e-mail are even more discouraging:
Is sprawl so bad? Many of the arguments against sprawl boil down to taste, e.g. sprawl lacks character. A key set of arguments that aren’t a matter of taste involve the environment, but…
Greater carbon footprint? Will the carbon footprint still be such a concern if cars are electric, and more and more electricity comes from renewable sources like solar power?
Rural land lost to sprawl? The US is still a mostly empty country, even today.
More obesity when people walk less? Yep, this is true.
Really?
  • The cost of sprawl isn't an issue of taste and character even if Howard Kunstler's book "The Geography of Nowhere" made it sound like it. Sprawl has a huge economic cost with its dispersal patterns for which services cannot sustainably provided over the long haul, whether it is schools, libraries, fire houses, roads, water, sewer, cable, electricity or the cost of pollution from well and septic. After a bonfire of revenues from development fees in initial years, sprawl is bankrupting communities when infrastructure starts to crumble.
  • The carbon footprint of the US is in large part so big because of sprawl. Electric cars and more solar power cannot eliminate the inherent inefficiency of sprawl.
  • The typical frequent flyer observation that the "US is still mostly empty" is the most ludicrous assertion of all. Yes, it is true, but what spaces are empty? What use are they to the people in dense metro areas like Baltimore-Washington. Maryland approaches European density levels, but thanks to unmitigated sprawl, without the typical European benefit of clearly defined communities that are surrounded by protected green spaces. 
    Low density housing shares in
    major cities (BuildZoom)
It is also interesting that neither author mentions David Rusk who made the exact same point 25 years ago with his inelastic and elastic cities theory which stated just like Romem that cities either grow outward or not at all and that those who can't grow are doomed.
I commented on Rusk in a recent blog arguing that especially legacy cities with their vast industrial sites have ample opportunity to expand inside their boundaries.
We have seen an astounding turnaround of cities since then, including some of the presumably doomed cities flourished.

Under the heading What is the path forward Romem offers three options:
The projected growth of the U.S. population will exert growth pressure on expensive and expansive cities alike. There is infinite nuance in how cities can respond to the challenge, but essentially they must situate themselves in the space defined by three alternatives. 
  • The first alternative is to expand with gusto. Cities that follow this path will maintain housing at more affordable levels, thereby retaining their current social character. However, going down this path will further entrench the ills associated with sprawl.  [..]
  • The second alternative is to avoid expansion, and maintain the status quo with respect to densification. Going down this path will divert population growth towards more accommodating U.S. cities (the expansive ones), [..] it will render housing increasingly unaffordable for a growing share of the population, and has already set in motion a sorting process whereby, on net, the affluent migrate into such cities while the less affluent are crowded out. [..]

  • The third alternative is to enact fundamental changes to land use policy that prompt far more substantial densification than any U.S. city has undergone to date. [..] It would require cities to stop relying on vacant lots as the primary means of densification, and embrace redevelopment instead. [..]
Neither the first nor the second are acceptable futures and Romem says so himself in so many words if one reads his full text. However, he makes the third sound like so impossible. He ignores that America is over-retailed and that every city has large commercial areas along its peripheral arterials that are underutilized or fallow. Those and abandoned industrials sites can easily be redeveloped without changing the character of residential communities. Each failing mall can become a dense mixed use neighborhood with lots of new housing. A change away from car orientation towards transit and autonomous vehicle fleet mobility will free additional vast amounts of space currently used for surface parking or parking garages or excessively wide streets. Again plenty of opportunities for density and growth without expansion.

If Baltimore manages to build up the 240 acre brownfield of Port Covington as planned with 14,000 new housing units, 20% of them set aside as affordable, it may become a large demonstration of what a city can do without being expansive.

Issi Romem sounds a lot like Thomas Robert Malthus in 1798 when he proclaimed in his book Essay on the Principle of Population   that the world won't be able to feed the ever growing population and projected nothing but gloom and doom. We know how accurate that prediction was.

Klaus Philipsen, FAIA


Thursday, September 15, 2016

What is LTS in bike network planning?

LTS stands for Level of Traffic Stress.

Who wouldn't want to bike with less stress? Even fearless bike enthusiasts who are not afraid to bike anywhere could do with less stress induced by fellow humans who share the road in much bigger devices and could kill you any moment.
Stress free: Bicycling in Copenhagen
Transportation planners long taught the world about VMT (vehicle miles travelled), ADT (Average Daily Traffic) and LOS (Level of Service).

The latest abbreviation, LTS, finally deals with something different than the car: The bicyclist! The idea to plan around stress  is derived from the observation that 70% of the population would consider using a bicycle if they felt safe, but only 13% actually feel safe and only 1-3% use a bike to get to work in real life.

In short, if bicycling could be made so that even more fearful folks wouldn't feel stressed, it is likely to ramp up bike usage. When does bicycling induce little stress? On greenways and trails, on separated bike lanes ("protected lanes") and on roads with little traffic.
Protected bikeway in Vancouver

Bike-planners who try to fit a bicycle network into existing east coast cities with their generally narrower streets have gone through a number of trials and errors. "Sharrows" that indicate that bikes share lanes are not very successful in lowering stress.

They also had to learn that narrow 3' lanes marked along a curb or parked cars does little to free bicyclists from the overwhelming sensation that any second the driver operating a ton or more of steel could misjudge the situation by a few inches and mow you down. Here Portland's, (OR) conclusion:
The Oregon Department of Transportation in 2014, also tracks comfort levels for bicyclists. His analysis found no statistical difference between comfort on busy arterial roads with painted lanes, and on arterials without lanes – painted lanes did not offer people on bikes much relief or perceived protection in the face of speeding traffic. This relation explains the importance of Portland’s decision this past February to establish protected bike lanes as the standard for new biking facilities. (mobilitylab)
Planners also realized, that putting the desired separated bike-lanes in which physical curbs, bollards or a row of cars parked 4'-5' away from the curb separate and protect cyclists from the moving cars, buses and trucks won't fit everywhere. So they built fragments here and there, an approach that they now call "facilities based". That approach leads to bicyclists enjoying a facility will find it abruptly ending just at those points where protection would be most needed.
Low level stress metrics used by Kittelson in
Baltimore (photo: ArchPlan)

With LTS the problem is viewed from the perspective of a network in which cyclists can get from A to B without ever running into high stress points. The solution: The low volume safe neighborhood streets! Once they can be utilized to fill the gaps between real facilities, voila, a network is born.

City DOT asked Transportation planners at Kittelson to develop such a network. A draft of it was presented yesterday to a dozen or so bike advocates at the offices of Bikemore on Maryland Avenue. (In a few weeks Maryland Avenue will be a "bike corridor" with a protected two-way bike facility!).

The draft map elicited a lot of suggestions from those who bike frequently and know the roads, shortcuts and secret connections. Pens in hand the maps were augmented.

A worthy crowd-sourcing approach to improve the GIS based map that showed quickly that the simple electronic mapping approach has a number of pitfalls:
  • Roads with single lanes were automatically considered low volume in the faulty assumption that the # of lanes would be a proxy for volume. But in reality, there are plenty of one-way two-lane roads such as Park Avenue that are much more comfortable to bike thanks to low speeds and low traffic than many single lane two streets such as Eastern Boulevard and Fleet Street.
  • Existing recreational systems were plopped on to the maps as low stress, even for those sections were they happened on the road in simple striped lanes without protection
  • Safety in terms of crime, visibility, eyes on the street, lighting etc. was not considered
  • The map did not differentiate between pleasant and unpleasant streets, for example street trees or active first retail along the way as a proxy. 
  • the calculated coverage (how much direct access to a stress-free connection from A to B the network provides overall)  is simply based on geometry and not on density and where people live, nor where they want to go (destinations like schools, universities, retail centers, libraries and the like).
Most of these problems can easily be fixed in an age where these attributes are readily available as GIS layers. But even  then, on the ground verification on a bike is needed.
A draft low stress network  map for Baltimore
Photo: ArchPlan

Overall, LTS is a worthy idea because it introduces a human value into the transportation world that is often trapped in the mechanistic thinking of  flow, volumes, delays expressed in sheer numbers that say little about the humans whom the transportation planners presumably serve. LTS is a step towards human based design thinking. 

Introducing the emotional well being of actual people into the equation is something I have long demanded ever since I became active in traffic calming on residential streets in my home-town of Stuttgart 40 years ago. I have tried to introduce it to transit planning as well (what will the transit rider see on her trip?), so far to no avail. As a bicyclist and walker I prefer a pleasant street where something happens over one that is dead and deserted anytime.  I think I am not alone in this. Kittelson has to go back to the drawing board and add the more emotionally charged layers to make the LTS map really plausible.

A few good bike corridors combined with the imminent bike sharing and a (online) map that shows realistic and pleasant routes connecting pretty much everything: Baltimore is on its way to become a much more bicycle friendly city!

Klaus Philipsen, FAIA

Stress free biking in Arlington County, VA
Recording Biking Comfort in Portland
Comfort level map legend Arlington, Va: Easy to understand

The Baltimore map legend? Ahem, what? (photo: ArchhPlan)


Wednesday, September 14, 2016

Baltimore: #26 in size but #10 in transit

A little known fact is that Baltimore, for all its complaints about miserable transit actually has more transit than many of its sprawling competitors that pushed us further and further down on the population ranking (Baltimore was once the nations second largest city after New York).
Transit in Baltimore, #10 nationwide (APTA)

That and other fun facts can easily be gleaned from Yonah Freemark's Transport Databook, on his blog Transport Politic. Assuming that the graphs are done right, they put together a compendium on important transportation and transit data that one has to otherwise go hunting on different sites, such as APTA's annual national report on transit agencies.

Below a few of the graphs readily available. On the graphs Baltimore is usually top of alphabetic list of color coded cities and it is blue. However, for the color impaired, there are many shades of blue to denote all the various cities, a problem that Baltimore will soon have to face  with the CityLink bus system that will color code in excess of a dozen lines inevitably leading to confusion for those who know only a few primary colors.

As the captions indicate, not all of these appear to be plausible or important. Since the Databook is new, there will probably be corrections made. The point here is to show this exists and encourage people to go hunting for the graph they care about.

Klaus Philipsen, FAIA

There are many factors that go into how high the subsidy per trip or passenger mile such as student trips, age structure etc  which makes it not really  a great measure for anything, still, it is provided as a "fun" fact that Baltimore is somewhere in the middle, requiring less subsidy than New York's ro Denver's buses
Ridership on the nations light rail systems is certainly a function of teh size of the network, but that in itself is telling, too. Baltimore's line is noted with a blue dot and is pretty far down, flat-lining essentially

Baltimore's graph for bus ridership is the one with the precipitous downward graph in June 12 which doesn't seem plausible. I don't recall what big event could have cause such a drop. Bus riders don't have many alternatives, after all.

In the mode split table of the nations top 15 cities Baltimore doesn't even register for overall transit share or rail, it does, for bus, though. According to this Baltimore is #10 with 28% modeshare for bus, better than Boston and Chicago, of course, those cities have extensive rail systems. DC, for examle beats Baltimore with a 33% modeshare for bus even though it has an extensive rail system as well.

In this table Baltimore is #12 in the nation for transit provision and utilization., a definition that relates the service to the population

This is the numeric table to the graph on top, showing the rather useless cost effectiveness factor.


Cost effectiveness for rail has the same shortcoming as the one for bus. The MARC system sits in a large filed of relatively low subsidies. To the right systems get rapidly much more expensive

Tuesday, September 13, 2016

Tough choices for Ellicott City


  • To catch the water volume that makes the difference between a 10 year and a 100 year flood event in the Hudson Branch watershed alone would require water storage akin to 33 football fields 6' deep.
  • If the entire watershed were wooded the water arriving at Main Street would be cut almost in half. 
  • If all 23 stormwater ponds in the watershed were not there it would make only an 18% difference for the 10 year storm and 10% in a 100 year storm. 
  • Fixing two culverts under Main Street and Frederick road at Ellicott Mills and Rogers Avenue could reduce local flooding in those local areas. (improved conveyance)
  • An additional 48" storm drain under Main Street all the way to the Patapsco would make only minimal difference, though.

Councilman Jon Weinstein explains his bill
This along with terms like gauge-calibration, Standard TR-20, back-watering, one and two-dimensional modelling, conveyance, scouring and velocity was swirling around in the council's meeting room on 3430 Courthouse Drive, the seat of the Howard County Government in Ellicott City. The government complex itself is an example of excessive pavement in the watershed that contributed to the flood.

In the room: The Ellicott City Flood Workgroup, 14 mostly white men hand-picked by Executive Kent Kittleman through executive order after the flooding that occurred as a result of Tropical Storm Lee in 2013. The group would sunset in November 2016 were it not for the wake-up call of the much worse flood that occurred this July.

As a result of that earlier storm (another "100 year event") the County had commissioned a comprehensive hydraulic study from the engineering firm McCormick Taylor. At yesterday's meeting the results of that study were explained in detail by the expert engineers and the results were not encouraging. There is neither a silver bullet of one heroic project that would solve all problems, nor is the continuation of business as usual an option.

To prevent business as usual Councilman Jon Weinstein explained his bill 65-2016 which would impose a nine month moratorium on all development in the watershed of the Tiber and Hudson. He reported that his first problem was a clear definition of the watershed from various conflicting maps . He was very relieved to find that group members had prepared a, what they considered accurate map of the watershed, which graced a wall of the meeting room. The moratorium would stop all development review except for those already in the pipeline including public works projects except if they are part of the recovery efforts. "Calamity repairs" or personal property improvements are also exempted.
Modelling the Tropical Storm Lee was part of the
McCormick Taylor study. This map shows the
flooding modeled for Lee.

Under chairwoman Debbie Slack Katz and guidance from Deputy Director of Planning Raj Kudchadkar the group debated its future (it wants to stay together after November), its relation with the parallel Citizen Advisory Council (can there be a merger?), the council bill (support) and what kind of storms the group wants to prepare for. ("Are we planning for another 1000 year storm?").

How much is a 100 year storm? In Maryland's piedmont around 7" of rain in 24 hours. 
The storm that hit Ellicott City recently brought just under 6" in only two hours. The tropical storm Lee in 2013 dropped 4.89" in two hours. The ratings of storms are based on rain in 24 hours.

The effects of rain used to be measured simply by flooding (i.e. backwater from the Patapsco) and mapped in FEMA flood maps. Lee and the recent storm showed that this isn't enough any longer.

Now the talk is about flash-floods, little branch streams turning into raging rivers that go over the banks and find other ways to rush downhill. The most obvious route: Main Street Ellicott City. The damage now occurs far away from the Patapsco which is shown as the biggest source of risk on traditional flood maps and the damage is not that things get wet and muddy: Whole walls and foundations got washed away by the strong currents, trees, cars and debris clogged culverts and channels.

Engineer Chris Brooks from McCormick Taylor admitted that the regulations are trying to catch up with the changing realities. (The to be assumed 100 year storm 24 hr rainfalls were recently slightly increased). His assignment after Lee was to identify what can be done that is "feasible and practical". Based on the damage of Lee his study was limited to the area from Roger's Avenue to parking lot "D" and addressed only the Hudson watershed of 1.55 square miles.

A new study commissioned by the County now has more urgency: In six months the full watershed all the way to the Patapsco is to be studied, including the Tiber watershed. "Everything is on the table", Brooks said, "we can do anything as long as it doesn't conflict with the laws of physics", it all depends on how much the community is willing to do".

He noted, that a 12' wide and 8' high storm culvert under main street would mathematically be enough added "conveyance" but it would require blasting rock, relocation of many existing utilities, conflicts with archaeological artifacts ("this is Maryland's oldest road") and would possibly back up when the Patapsco would carry high water as well in a more extensive slow large area storm. He also cautioned that the Department of the Environment frowns on inline ponds (dams), that a huge pond upstream at Walmart or at the 29/40 interchange was technically possible but could pose a hazard of another kind with dams more 20' high and above the town and may be too high up in the watershed to catch enough water.

Was he "optimistic that the problem could be solved at all", one member of the work-group asked in desperation. Brooks responded, that this was the most complicated  and difficult case he has encountered in his career (He is relatively young).

The Flood Group will have its hands full beyond November.
Velocities modeled by the two-dimensional flood
model used for a part of the Hudson watershed

It should remember that 50% of the total water volume comes from development, that all current ponds are designed only for 24-hr 100-year storms and release all excess water beyond that as if they didn't exist, that probably in excess of half of the existing development has no stormwater management at all.

Solutions that involve upgrades to existing facilities, additional mandates for development without ponds, a prohibition of additional larger development and fortification of buildings in the valley seem to be in order.

The real culprit in the last flood was the force of the water as a result of velocity and volume. If the force is broken, fortification against relatively still water occasionally rising into buildings should be possible. Regs and the engineering toolkit are very focused on volume. The dynamics and energy of water velocity need to be added to the consideration. No longer is it just flood-maps that matter.

The difference in damage between storm Lee with its 4.89" in two hours and the recent one with its near 6" in two hours proves that an incremental difference of 20% can make a critical difference in outcome after all.  20% is just about the cumulative impact that Brooks attributed to a variety of practical improvements in the watershed.
In hydraulics few things are linear.

Klaus Philipsen, FAIA


From the Maryland Stormwater Manual about Extreme Flood Volume (Qf):
 The intent of the extreme flood criteria is to (a) prevent flood damage from large storm events, (b) maintain the boundaries of the pre development 100-year Federal Emergency Management Agency (FEMA) and/or locally designated floodplain, and (c) protect the physical integrity of BMP control structures. This is typically done in two ways: 100-Year Control: requires storage to attenuate the post development 100-year, 24 hour peak discharge (Qf) to pre development rates. The Qf is the most stringent and expensive level of flood control and is generally not needed if the downstream development is located out of the 100-year floodplain. In many cases, the conveyance system leading to a stormwater structure is designed based on the discharge rate for the ten-year storm (Qp10). In these situations, the conveyance systems may be the limiting hydrologic control. Reserve Ultimate 100-Year Floodplain: 100-year storm control may be required by an appropriate review authority if: • buildings or development are located within the ultimate 100-year floodplain, or • the reviewing authority does not completely control the 100-year floodplain. Hydraulic/hydrologic investigations may be required to demonstrate that downstream roads, bridges and public utilities are adequately protected from the Qf storm. These investigations typically extend to the first downstream tributary of equal or greater drainage area or to any downstream dam, highway, or natural point of restricted stream flow


Monday, September 12, 2016

A Misguided case of "Transit First"?

Many cities adopted Portland's, (OR) transportation priorities that put pedestrians, transit and bicycles ahead of cars. Those cities remodeled their streets around those re-stacked priorities in what is typically called a Complete Streets policy. Baltimore has such a policy in place, too, but it hasn't been implemented. A transit first policy simply hasn't happened yet in Baltimore.

Until now. Finally we have a precedent for an actual implementation of a transit before cars policy, but it isn't clear that the City will get a lot of praise for it.

The unlikely application of the policy: The Westside sinkhole on Mulberry Street (US 40 eastbound) and the measures to prepare for a fix. The installation of temporary surface sewer main detour along Franklin Street (US 40 westbound) came to a screeching halt at Howard Street because of transit. The question: how to cross the light rail tracks without disrupting trains.

In applying transit first, it was decided that the 25,000 or so August light rail riders couldn't be inconvenienced with a solution that would cut the tracks. Not for a few days and even less for a few months. So instead of putting the temporary sewer pipes in a shallow trench that is covered with steel plates so cars can roll over them as it was done at intersections without rail, the engineers went back to the drawing boards and a lot of head scratching and investigating. After months of deliberation and obtaining permits they came up with a solution that is reminiscent of building the tunnel-section of the cancelled Red Line: A combination of open cut and cover and underground boring.

The result: a hole in the middle of Franklin Street that is bigger and deeper than the sinkhole in Mulberry Street and took weeks to create.

The neatly framed out gigantic pit in the middle of West Franklin Street. At bottom see assembled boring machine that advances the pipes deep under Howard Street. The yellow scaffold is a staircase for workers to reach the bottom.
 (Photo ArchPlan)

The problems with this transit first decision are numerous:
  • This exercise happens in the middle of Franklin Street and closes the street for about two months,
  • Busy route 40 with an order of 25,000-30,000 vehicles in each direction per day is closed both ways, at Mulberry and at Franklin Streets.
  • While the sewer detour remains disconnected, sewer spills untreted into the Inner Harbor, during rainstorms in signficant quantities.
  • the pit that is needed to place a tunnel boring machine 25' below street level is an extravagant 24/7 engineering  fete that requires piles, steel plates, huge excavators, vacuuming and cranes that lift equipment in and out that seems completely out of proportion for placing a temporary sewer pipe so a sinkhole can be fixed
  • the cost of the boring exercise is not provided, since all work is performed on time and material (T&M). The SUN reported that the Centre Street and Mulberry sinkhole repairs combined are estimated to cost over $10 million, $6-7 million for Mulberry Street alone. The tunnel boring is the most complicated part of this followed by the cost for lining the full stretch of the sewer line with liquid plastic to reinforce it against future failure.  I would estimate that the mini tunnels will cost at least $1-2 million if not more.
The pipe being pushed into the bored hole under Hoard Street (still
above the Howard Street tunnel)
The alternative to the tunnel would have been the usual shallow trench that would have cut the rails.

The 2' concrete slab that carries and embeds the rails could have been replaced within days and could have been poured around the shallow steel pipes reinstating the full structural integrity of the slab and rails within a week. During that week rail passengers could have dis-boarded on one side of the construction area and boarded a waiting train on the other.

Possibly this may have meant to disrupt the shuttle service to Penn Station in order to get the necessary train cars to do this; similar operations with bus bridges in between have been done before.
Again, the cost for this short term construction and altered LRT operation is only a wild guess, but I would place it in the range of $100-200,000 at the most, i.e. one tenth of the pipe tunneling with a disruption or inconvenience of a smaller number of people over a much shorter time.

Transit first should not be a policy in which Peter is robbed to pay Paul and it shouldn't be executed on the backs of the environment, businesses and residences around what has become an enormous construction site when it could have been much less of an imposition. 
Regular pipe crossing at intersection with steel plates
(photo: ArchPlan Inc.)

The biggest irony of all of this: Mulberry Street had been trenched  for placing a new water main only three weeks or so before the sinkhole occurred. That new water main never went life before the street collapsed. The trench had given a good view of what was going on under the concrete street cover. From what I was told reports of cavities and wash-outs were followed by instructions to just fill the voids up again.

The reason was classic cars first policy: Mulberry was a street too busy to be closed for a proper investigation.

Klaus Philipsen, FAIA


Friday, September 9, 2016

Sagamore and Baltimore's Future

It is telling that the announcement of the amended Memorandum of Understanding (MOU) between the City and Sagamore that included upgraded community benefits was not held at City Hall. Instead, the Mayor and Council President schlepped out to Port Covington and Kevin Plank's new home turf at City Garage. It was as if the City were the one asking for something and not Sagamore. But such are the power conditions in Baltimore. 
Councilpresident Young and council members at the MOU announcement
at City Garage Thursday (Photo: BBJ)

Early on Sagamore had engaged directly with the surrounding communities which they dubbed the SB6 communities for a MOU with them. The City stood on the sidelines and just waved everything through from BDC to the Planning Commission to the City Council. 

Only there and at Councilman Stokes' Land Use Committee which had to hear three bills before they could advance to the full Council, did the fast moving project to a full stop. Stokes, an outspoken critic of the Harbor East TIF scheduled a number of hearings that slowed things down and gave the public a voice. 

But things turned out differently, than even Stokes had imagined. The huge War Memorial Hall was barely large enough to hold all the interest groups and interested citizens. The hearings bore little resemblance to the usual hearings of the City Council and unfolded their own dynamic in which the Council largely became a bystander, or a facilitator of spirited negotiations between Sagamore, a coalition of churches and various unions. 

The full War Memorial Hall with Sagamore's Weller in foreground
How much the Council was overwhelmed showed last night at the hearing that followed hours after the new MOU had been announced at City Garage. Council President Young and committee chair Stokes did not really control the process; that fell to the new "unholy alliance" of BUILD church leaders and Sagamore which framed the event. 

“Prior to the negotiation, there was an agreement with nebulous goals and promises. After the negotiation, there are specific mandates around local hiring, workforce development, and affordable housing that the developer will be required to meet....Never again can a developer come to the public subsidy trough without concrete mandates around local hiring, workforce development, and affordable housing.” Foster Connors, BUILD co-chair 
By showing up side by side with Sagamore ("A new day in Baltimore") BUILD itself became the target of noisy shouts and disruptions (Reverend Glenna Huber was even called a scab) which added some confusion but did little to change the course. After some testimony and in a last ditch effort to seize control, Councilman Stokes abruptly brought the meeting to a halt and declared a recess before the third bill had been brought to a vote, the critical bond financing bill. 

Confusing everyone including his own colleagues, Stokes said there was not enough time between the publication of the new MOU and the vote. Earlier in the proceedings Stokes was clearly frustrated and said so as chair through variously contrite and aggressive comments that piled on the City as the "worst player" and lauded Plank as one that has "shown that he contributes to Baltimore". He then opened the MOU up for his own wishes not with a specific amendment proposal but expressing generally that the risk of possible school funding losses should be carried solely by the developer and some vague statement about profit-sharing, an item that is apparently still separately negotiated with the Baltimore Development Corporation. Councilwoman Clarke piled on with a request that all construction of the entire development (not just infrastructure) should be "prevailing wage", a request that could add hundreds of millions of dollars to the cost of the 5 billion private investments which typically don't have to abide by Davis Bacon wage rules. None of the amendments ever came to a vote in the chaotic proceedings that had no resemblance to Roberts Rules of Order.

What matters in the end are the outcomes, even if the process may have been messy. Most agree that the MOU has become much more favorable to the City and communities no matter that it wasn't the Mayor, BDC or the official agencies that are responsible for this improvement, and that council members Young, Costello and Stokes were mere facilitators.

Union leaders shout down BUILD speaker Reverend Glenna Huber
More than any other organization, it appears that it was the coalition of churches known for 30 years as BUILD that did it. That was entirely unpredictable. They came to the party late, after Sagamore had already met for months with the six surrounding communities called SB6 and had signed a MOU with them.

BUILD did not come to any back rooms but showed up in force at Stokes' public hearings. They held fiery speeches, shouted and generally made a lot of noise. But that was not all: In a really smart move they had armed themselves with their own TIF expert consultant whom they had paid out of their own pocket, an expert in reviewing TIF applications. The expert had a bunch of items to criticize. An independent review that should have been conducted by BDC which relied entirely on the consultant Municap which in turn relied entirely on numbers provided by Sagamore. 

BUILD and other groups who objected to the initial MOU achieved through a good old power play and tough negotiating that Sagamore agreed to double the amount of affordable housing. Sagamore also agreed to commit to 30% local hiring up from a 20% "goal".  BUILD declared this "a new day in Baltimore". "this deal is a far from where we started". The BUILD spokesman even took over the Sagamore slogan, "we will build Port Covington together" and changed it to "we build one Baltimore together." 

At yesterday's hearing some were still not satisfied. In the once again overflowing War Memorial Hall they called Reverend Genna Huber of BUILD a scab when she praised the outcome as a result one can live with even if it isn't " a panacea". It must have been quite an experience for the reverend who, only a few weeks ago, had roiled the same room with a hearing contribution that was so fiery that its end became drowned out by frenetic applause. 

Union spokesperson Williams began analyzing the process by blaming the council and not Sagamore for what he sees as a public-private partnerships that is carried out on the backs of working people. 

As instructive and telling as all this is about the current conditions in Baltimore and as trailblazing the new MOU may be in terms of equity and social justice, one has to wonder how realistic Plank's big plans and commitments really are. how the economics of all this will work. 

I would have preferred a deal where the City would participate in sound profit sharing in a system where the benefits go up and down depending on how well the project fares. (Like the Casino deal).

There is much that can and will happen in the next few decades. Large Baltimore players disappeared over the last 30 years:  Doug Becker and his Sylvan Learning (Remember, he was the local wunderkind before Kevin Plank), Struever Brothers, Pat Turner and his big Westport dreams, Ed Hale and his Canton Crossing dreams, various owners of the Sparrows Point Steel mill, Alex Brown, General Motors and many others should give us sobering pause, even if their works were usually carried on by successors.

For example, the doubled affordable housing component of which 60% need to be realized within the Port Covington development area itself and 40% can be built elsewhere in the city: Everyone knows that affordable housing needs steep subsidies to be developed, especially in weak markets. Where would the subsidies come from? Experienced affordable housing developers routinely cobble projects together from a dozen funding sources including the super competitive affordable housing tax credits for which even savvy developers often have to apply year after year before they succeed. Sagamore has no experience in the field. To construct 2,800 affordable units is a daunting task, even if it occurs over 20 years or so.

The "prevailing wage" requirement is a laudable thing as well, but as developers who use public funds, which can stipulate those wages know, "Davis Bacon" adds significant cost to a project. The Red Line cost estimate, for example, was in part so high, because of the many wage and procurement rules governing the project.

In short, everything that is in the MOU costs additional money on a project that even the BUILD consultant had considered only marginally profitable to begin with. It is highly likely that Under Armour can build its own headquarters at Port Covington, no problem. A signature investment like this headquarters can spur development, that was visible with Tide Point in Locust Point, UA's current headquarters, even before UA moved in there. But is there really demand for 14,000 housing units on top of the thousands that are currently under construction and an entire new town?

For this heavy lift to work mayor and City Council need to up their game. It will no longer be sufficient to just watch what happens. For Baltimore to finally break its bonds, it needs social justice and equity, but it also needs leadership at City Hall that sets the many disjointed initiatives up in a way that they finally add up and become synergistic. Everyone celebrating the historic Sagamore new deal and its community benefits needs to realize that the lift just got heavier.

Klaus Philipsen, FAIA

A correction was made regarding the proposed amendment to subject all construction to "prevailing wage" rules. That motion came from Councilwoman Mary Pat Clarke, not a member of the Land Use Committee. Not from Councilwoman Ricki Specter as initially reported due to poor acoustics and visibility in the hall. The article has been augmented about profit sharing as an item apparently still negotiated between BDC and Sagamore. Nothing about that appears to be public. 


From the new MOU Summary of terms released yesterday: