 |
| Urban romance: No longer alone |
Ok, true, there are only a few, a very few, that share all of those problems, but still, they exist. One needs to go to a coffee shop in St Louis, Buffalo, Kansas City or Oakland and one would hear the same stories and one wants to scream: Just like in Baltimore. One way to solve the many problems is for residents and politicos to get out of town and see how others do. Travel isn't always possible, it is even frowned upon, especially if local politicians do it. Finding a soulmate online from the comfort of one's office could be an answer.
Wouldn't it be nice if all those despairing and lonely cities could find their peers? Online city dating with the motto "shared misery is less misery".
The Federal Reserve of Chicago, yes, the Federal Reserve! has come up with just that: Peer Cities online, dating for cities. In more prosaic terms: The Peer Cities Identification Tool (PCIT) grows out of the multi-year Industrial Cities Initiative and leverages the ICI300 dataset. Peer cities are grouped along four themes:
- Equity (wage-based Gini coefficient, race and ethnicity-based dissimilarity indices, changes in poverty levels, and educational attainment)
- Housing (income-to-home price ratio, rent burden, housing age, and monthly living costs)
- Resilience (manufacturing employment, labor force participation, and unemployment)
- Outlook (changes in the working age population, family composition, mobility, and age distribution)
 |
| Inequality index: Wrong trend but not the worst (Baltimore is the red column) |
The metric of Resilience brings up the expected peers of New Haven, St Louis and Oakland but it also brings up the two Richmonds (Virginia and California), Fort Lauderdale, Philadelphia, Wilmington and the two true metropolitan stars of Chicago and Los Angeles plus a bunch of other places many may have hardly ever heard of, including serveral small towns in Massachusetts. The good news: Baltimore isn't bottom in any of the 7 categories listed under the metric of resilience.
The Peer City Identification Tool (PCIT), developed by the Community Development and Policy Studies division (CDPS) of the Federal Reserve Bank of Chicago, is a data comparison and visualization instrument that can help policymakers and practitioners understand a municipality in the context of peer cities. Drawing on city-level indicators from the American Community Survey and historical Decennial Census records, the PCIT performs a cluster analysis to identify groups of similar cities along economic, demographic, social, and housing dimensions. The 300 cities included in the data-set had a population of at least 50,000 in 1960. Today, they have a median population of just over 100,000. (website)
We are second worst in unemployment and labor force participation rates (11%/61.9%) after Philly (11.9%/59.7%) and in manufacturing share/ loss of manufacturing from 2000 to 2015. With a dismal 4.7%/-81.6% Mt Vernon, NY beats us for bottom place with 3.6%/-83.3%. But it is shocking to see that Baltimore lost over 80% of its manufacturing jobs in just 15 years (the statistics go only to 2015) it maybe comforting to also see that even the best performing peer city has lost 59% of its jobs in that sector. We are not really great in median income ($51,000) but at least four other cities do worse with New Haven being rock bottom ($45,500). Best on median income: Baltimore gained 4.6% in the last 15 years while the median of the entire peer group is a loss (-7.4%).
 |
| Median monthly housing cost: Baltimore (red) is up there, but not the worst |
Under the Housing metric Baltimore isn't a national loser either. Its rate of vacant housing is with 18.1% better than Harrisburg, PA (18.9%), Birmingham, AL (20.1%) and vacancy leader St Louis (20.5%). With 48.4% of renters being rent burdened we are just a tad under the national median of 47.3% and on par with Wilmington, DE.
Maybe most encouraging, Baltimore fares really well under the category titled Outlook if one can trust the metrics of the inventors of this peer tool: Baltimore has with 7.7% more foreign-born residents than the peer median of 5.9%; with -4.4% lost population Baltimore has less population loss than the median of the entire peer group (-8.7%). Finally, with 50.3% the city also has more households with children than its peers (48.3%) with arch-rival Pittsburgh only having 43.8%.
 |
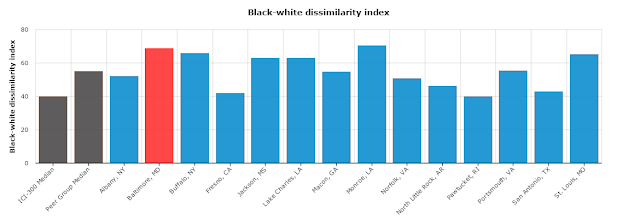
| Black white dissimilarity index: Only Monroe, LA has a worse index |
Ah, isn't that city Tinder fun, feeling better already? Ok, don't get too elated, in the equity category and the dissimilarity between black and white Baltimore is with a bad rate of 68.9 a startling 13.7 points above the group median (higher is worse in this case) and almost the worst were it not for Monroe, LA. Even St Louis and Buffalo do better than we in the dissimilarity category. But both of those peers have a higher poverty rate than Baltimore's 19% (Buffalo 26.2%!) and even the peer median for poverty is a bit higher than Baltimore (19.2%). In educational attainment we easily beat the peer median of 25.6% with our 28.7% bachelor degree rate, but have to accept that St Louis beats us with their 31.9%.
There is probably much to quibble about the method of how peers are assembled, namely by having similar statistics in one of the categories and not by true comparability in terms of geographies, demography, size and economic base. Thus the peers change depending on the metrics. Who would normally consider Ft Lauderdale or Pawtucket, RI, or Lake Charles, LA a peer to Baltimore? Alas, unusual pairing spices things up, just like on Tinder.
Klaus Philipsen, FAIA
No comments:
Post a Comment